How Henrico watches for floods during a historic drought
Earlier this month, Henrico County announced the installation of a countywide network of stream and rain gages, and the timing could not be more pointed.
Real-time flood monitoring is now in place during a summer marked by both a historic drought and a recurring string of flood watches and thunderstorms throughout Central Virginia.
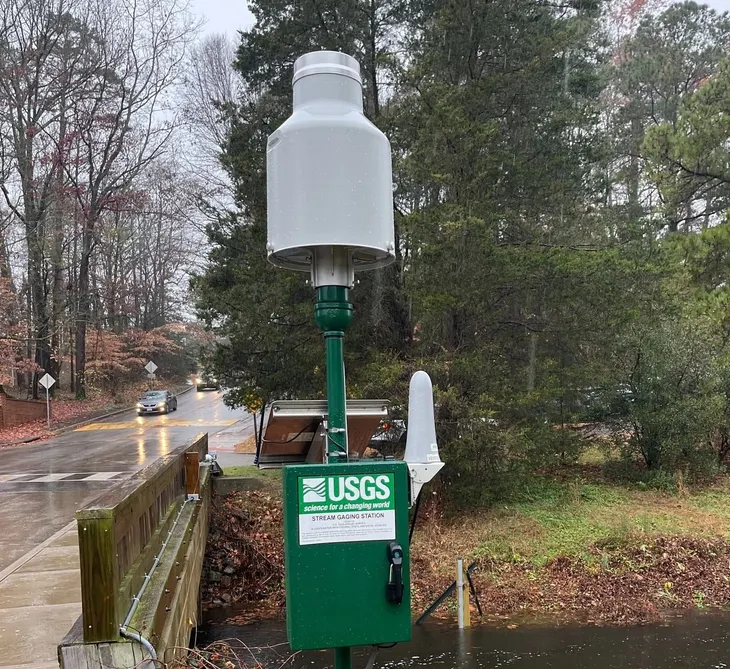
Henrico Public Works, in partnership with the U.S. Geological Survey, has installed 21 Henrico-funded gage stations tracking water depth, precipitation, or both. (The county uses the "gage" spelling that has been endorsed by the United States Geological Survey for more than a century.)
USGS, which maintains a broader regional network, monitors 30 stream and rain gages total within county lines. The difference is that not every gage inside Henrico’s borders was paid for by the county. A few more sites are still in the works as USGS finalizes permissions, according to John D. Jastram, chief of the Watershed Studies Section at the USGS Virginia and West Virginia Water Science Center.
That network is now doing double duty. This summer alone has brought repeated flood watches and pop-up thunderstorms to the area, even as Virginia sits in its driest stretch since 1941. It sounds like a contradiction. But the same gages Henrico built to catch flash floods are also part of how the region is tracking the drought.
The stakes behind the network are laid out in the county’s own funding application. Henrico has about 24,000 acres of floodplain and 24 properties classified as repetitive or severe repetitive flood-loss sites, meaning they’ve flooded and been paid out on insurance claims more than once.
More than 2,000 properties countywide carry some known flood risk, according to the application Henrico submitted to the Virginia Community Flood Preparedness Fund.
A history of floods
The county’s flooding history dates back further than most residents may know. The application cites a 1771 James River flood that reached 45 feet above normal and killed about 150 people, along with major damage from Hurricanes Camille, Agnes, Juan, and Gaston in the decades since. (Additional information about these events is available on the county’s Flood Resiliency Story Map.)
“The USGS is required to make our data public, and that's what makes them very useful for those in-the-moment response type activities,” Jastram said. “Through conversations with our partners at Henrico County, they identified a need for data about their streams and hydrology in the county for multiple purposes.”
That need started narrow. Jastram said the county didn’t have much of a stream-gaging presence before this project. The first gages went in at five county-owned dams in 2021, largely for dam-safety monitoring. From there, according to Henrico Public Works Watershed Engineer II Marie Benavides, the county recognized the broader data gap and began chasing funding to close it.
“Funds for all gages were a combination of county investment and a Virginia Department of Conservation and Recreation grant of about $560,000,” she said. “USGS contributed the cost and purchase of required equipment and infrastructure.”
Benavides said sites were chosen using a mix of criteria: how often a road floods, whether the county already had even data coverage across its watersheds, and complaints from residents. Full detail on the selection methodology lives in the county’s CFPF grant application.
Jastram put the county’s priorities in three tiers:
• dams and reservoirs first, since those carry the most serious failure risk;
• then streams with a track record of flooding roads or other infrastructure;
• and finally, a network of rain gages aimed at catching the kind of hyper-local, high-intensity downpours that have become more common in recent summers.
Even a strong candidate site can get ruled out. USGS site visits sometimes turn up disqualifying problems, such as a channel too narrow for reliable readings, too much tree cover, or other physical constraints that make accurate measurement impossible at that exact spot.
Jastram’s observation about “high intensity, very localized rainfall these days” isn’t just anecdotal. Henrico’s grant application cited projections from NOAA's Mid-Atlantic Regional Integrated Sciences and Assessments team showing the county’s average annual rainfall is expected to increase by about 2 inches by the 2050-2079 period compared with the 1990-2019 average — part of the reasoning behind building out the rain-gage side of the network now.
Henrico owns five dams including Canterbury on Pump Road, Echo Lake, Cox Road, Wyndham and Wellesley. During a stretch of heavy storms in the spring and summer of 2018, the Canterbury Dam overtopped, flooding downstream properties and closing several roads, according to the county’s grant application. That kind of event is exactly what the first round of gages, installed in 2021, was built to catch.
Some of the new instrumented sites replace a much lower-tech system residents may remember with simple depth markers, like a ruler bolted to a post, at spots that flood again and again. Public Works officials confirmed that some of the county’s historic trouble spots are now instrumented as part of this network.
Why it floods when there's a drought
So, how can a place be desperately dry and still get hit with flash flooding?
“We're getting floods because we're having high-intensity rainfall events, where there's more runoff,” Jastram said. “Regardless of the longer-term climatic conditions, those heavy bursts of rainfall are going to produce runoff, and that's going to result in flooding.”
In other words, a drought is a measure of accumulated deficit over months. A flood watch is about how much rain falls in a short window. The two aren't measuring the same thing, so there’s no contradiction in having both at once.
FLOODING RESOURCES
• Water Alert — A free USGS service that lets anyone set a threshold for a specific gage near their home. If a driveway or road floods once the water hits a certain level, residents can sign up to get a text or email alert when that threshold is crossed.
• CoCoRaHS — For residents who want even more localized rainfall tracking than the county network provides, this community rain-gage program lets people report data from their own backyard.
• Private property drainage or flooding issues — Contact Henrico Public Works at (804) 501-4552 or residential_drainage@henrico.gov.
• Storm debris or blockages in a public right-of-way — Contact Public Works at (804) 727-8300 or dpwroads@henrico.gov.
Benavides added a related but distinct wrinkle, specific to what happens underground during a sustained rain event. Dry soil, she said, actually tends to absorb water well at first, which can feel counterintuitive, since parched ground feels harder underfoot.
Soil is full of tiny void spaces that let air and water move through it. But those spaces have a limit.
“After a certain amount of rain, which varies across the different types of soils, those void spaces are essentially filled up and the soil is not able to allow more water to infiltrate,” Benavides said.
Once that happens over several consecutive days of soaking rain, whatever falls afterward has nowhere to go but downhill, as runoff and ponding. Two different mechanisms, both landing on the same result: intense or prolonged rain generates flash-flood risk no matter what the yearly rainfall tally says.
The same data, but two different jobs
The good news is that the gages don’t distinguish between a “drought reading” and a “flood reading.” They measure water depth and rainfall, continuously, and different people use the same numbers for different purposes depending on the moment.
“These gages give us actual data to help us quantify the frequency and magnitude of those events,” Jastram said. “Local governments can use that information to plan accordingly and potentially make adjustments to infrastructure based on the magnitude of that flooding.”
Benavides said the same data feeds floodplain management, emergency management planning and reducing flood risk more broadly — the year-round, unglamorous work that only makes headlines during a crisis.
Data collected today also builds toward something the county didn’t have before: a real historical record. Multiple years of readings let hydrologists study flood frequency, support watershed management, evaluate water availability and inform planning decisions that used to rely on guesswork or resident complaints.
“These hydrologic data become the foundation of any type of environmental study that’s related to our streams,” Jastram said.
The data isn’t locked away in a government office. It updates within about an hour of being collected and is publicly available on the USGS National Water Dashboard, which includes a page focused specifically on Henrico County’s network.
The gages themselves won’t stop a road from flooding. But as Henrico moves through a summer that’s delivered both a historic drought and a flood watch within the same news cycle, they're the reason the county can tell the difference between the long, slow story of a dry year and the short, sharp story of a single bad storm.